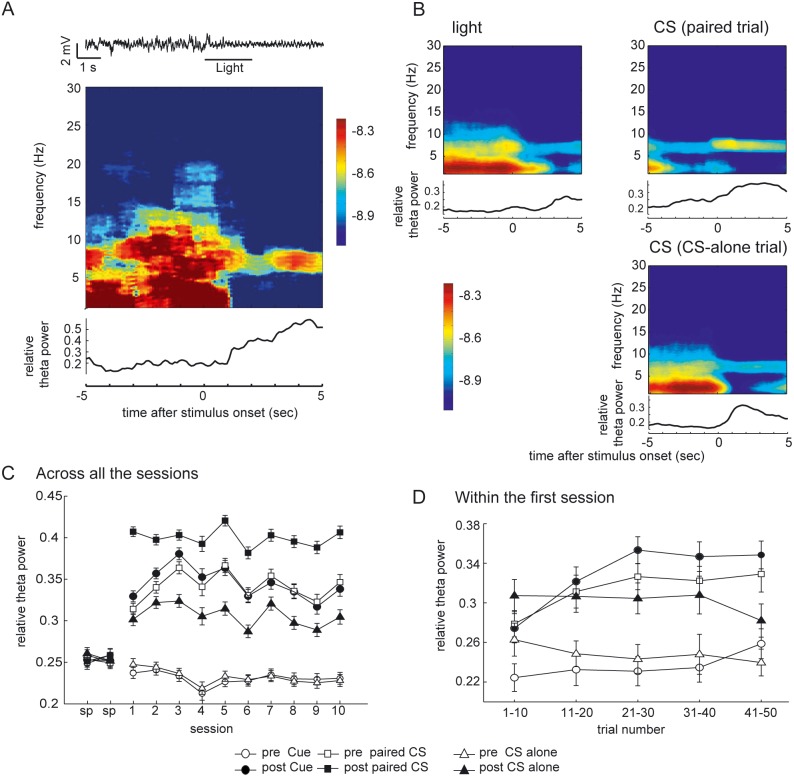
Figure 4. Elicitation of the hippocampal theta by the stimuli.
(A) (B) The dynamic power spectra showing the elicitation of theta oscillation by the stimuli. Note that the main reason for the predominance of the theta rhythm is the decreased power of frequency ranges other than theta, while the absolute power of the theta range remained constant. (A) A representative LFP signal around a presentation of the light cue. The theta oscillation is elicited by the presentation of the cue. The middle panel shows the dynamic power spectra for the same trial using a 2-s moving window. The lowermost panel trace shows the relative power of the theta frequency range calculated for each time point using the moving window centered at that time. (B) Dynamic power spectra around the stimuli and the relative theta power. Theta band activity is evident after presentation of both the conditional light cue and CS. Shown are the averages across all the trials for each stimulus type in the session 10 of a rat (50 trials each). x axis, time (in s); y axis, frequency (in Hz). The color scale represents the signal power (in log10V2). The width of the moving time window is 2 s long. The relative theta power was calculated with the average dynamic power spectra showed above the trace with 2-s time window. (C) The relative theta power (5–8 Hz) calculated for each 3-s prestimulus and poststimulus interval. The average relative theta power over all valid trials from the same day across 5 rats. Vertical bars indicate the standard error of the mean. (D) Same data from the first acquisition session calculated for successive blocks of 5 trials. The data for post paired CS period are excluded. Vertical bars indicate the standard error of the mean.

