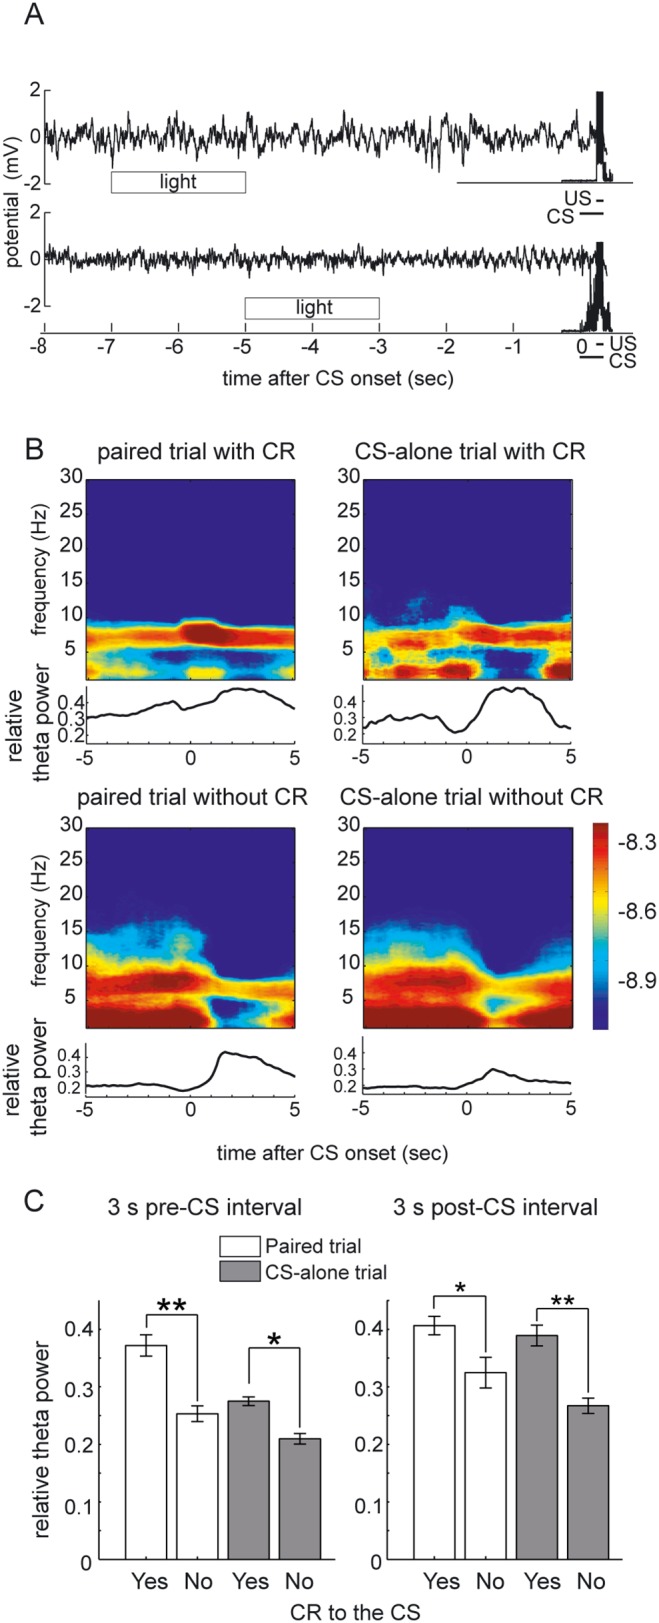
Figure 5. Dependency of the CR expression on the state of hippocampal LFP before the CS onset.

(A) LFP signals and EMG amplitude signals for two successive paired trials (trial 24 and trial 25 in session 10). The theta rhythm is absent and no CR response is observed in the former trial. A prominent theta rhythm and successive CR response are observed in the latter trial. (B) Averaged dynamic power spectra around the CS presentation calculated separately according to the trial type and presence of CR. Theta band activity is evident before the presentation of CS in the trials with CR expression. Shown are the data from the session 10 of a rat. x axis, time (in s); y axis, frequency (in Hz). The color scale represents the signal power (in log10V2). The width of the moving time window is 2 s long. The lower traces corresponds the relative theta power calculated from the average dynamics spectra shown above. (C) The average relative theta power across the last 5 sessions (sessions 6–10). All the valid trials in those sessions for each rat were separated according to the trial type and presence of the CR to the CS for the calculation of the relative theta power. Then, the average relative theta power across all the rats was compared. Significant difference were observed between CR trials and no-CR trials (paired t-test, **P<0.001; *P<0.005). Vertical bars indicate the standard deviations.
