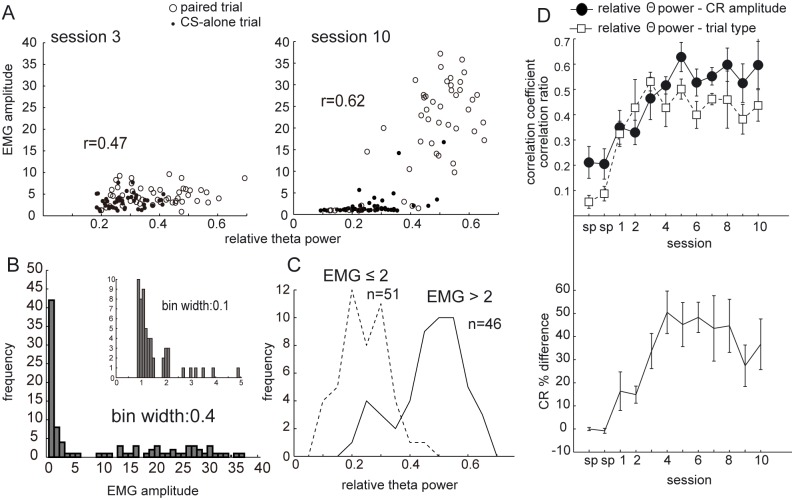
Figure 6. Correlation between CR amplitude and theta power.
(A) Scattergrams showing the relationship between CR amplitude and relative theta power. Each point indicates each trial. Open circles correspond to paired trials and filled circles correspond to CS-alone trials. Shown are data from one rat (rat t6). x axis, relative theta power of 3-s prestimulus interval calculated for each trial; y axis, normalized CR amplitude. (B) Histogram of CR amplitude for session 10 from the same rat. Sharp peak around the value 1 corresponds to the trials without any response to the CS showing spontaneous level of EMG. The distribution shows a clear bimodal clustering tendency. (C) Histogram of relative theta power of prestimulus intervals for session 10. The trials were divided according to whether the EMG amplitude is bigger or smaller than 2. (D) The upper panel shows the plots of average correlation coefficients between CR amplitude and relative theta power for the 5 rats, and average correlation ratio between trial type (paired trial or CS-alone trial) and relative theta power for prestimulus interval for the 5 rats. The lower panel shows the plot of average CR percentage difference between paired trial and CS-alone trial for 5 rats. Each value was calculated for each session, and then the average and standard error were calculated across 5 rats.

