Fig. 3.
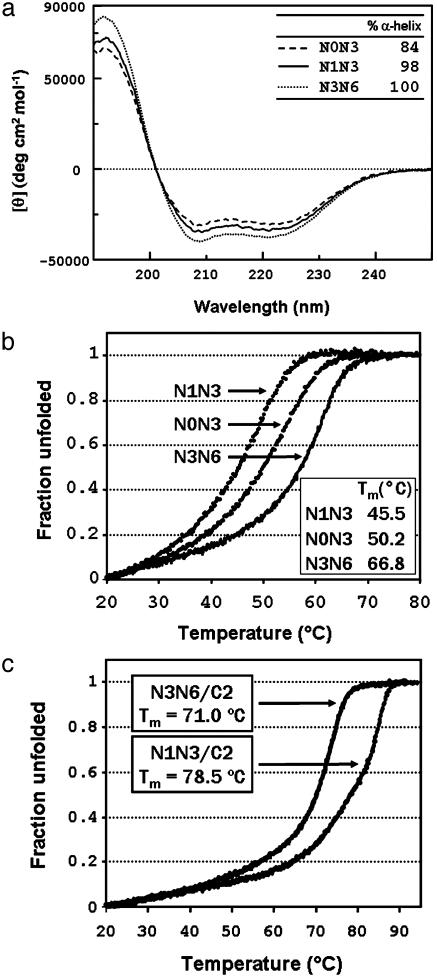
(a) CD spectra of peptides N0N3, N1N3, and N3N6 (Table 1). The calculated percentage of α-helix is indicated. (b) Thermal denaturation curves with indicated Tm values of peptides N0N3, N1N3, and N3N6. (c) Thermal denaturation curves with indicated Tm values of the N1N3/C2 and N3N6/C2 peptide complexes.

