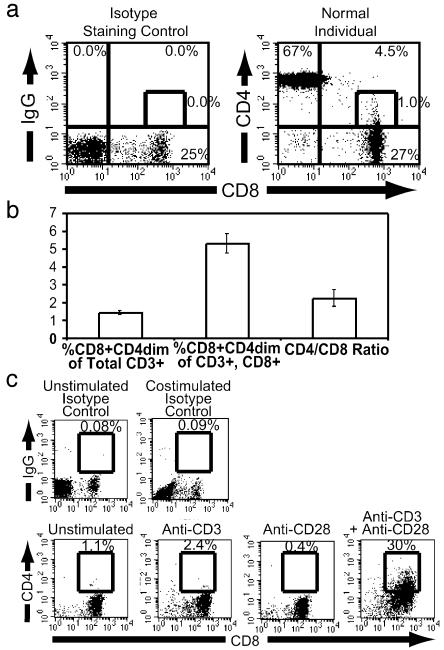
Fig. 1.
Identification of CD8+CD4dim T cells. (a) CD8 vs. CD4 expression on CD3+ peripheral blood lymphocytes from a healthy, HIV-negative individual. The single-color (energy coupled dye) isotype staining control identifying cells stained for CD8 and nonspecific mAb is identified (Left). CD3+ cells were identified by gating and CD4 versus CD8 expression is shown (Right). The percentage of cells in each quadrant is indicated at the outer edge; percentage CD8+CD4dim cells of entire population is given next to the indicated gate. (b) CD8+CD4dim cells in normal, HIV-negative individuals. The percentage of CD8+CD4dim cells of the total CD3+ population (left), the CD3+CD8+ population (center), and the ratio of CD4 to CD8 T cells (right) are given. (c) Costimulation of CD8+ T cells. CD4 and CD8 cell surface expression after 3 days of stimulation in the presence of medium, anti-CD3 alone, anti-CD28 alone, or anti-CD3 plus anti-CD28. The single-color (energy coupled dye) isotype controls are shown to indicate nonspecific background staining. The boxes are drawn to include CD8+CD4dim cells, and the numbers above the box denote the percentage of CD8 cells expressing CD4.

