Figure 7.

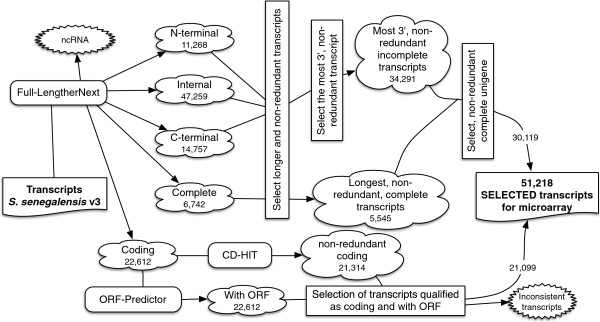
Schematic representation of the probe selection strategy for the construction of the Senegalese sole oligonucleotide microarray. The number of transcripts that resulted after the described filtration is indicated.

Schematic representation of the probe selection strategy for the construction of the Senegalese sole oligonucleotide microarray. The number of transcripts that resulted after the described filtration is indicated.