
Figure 3.
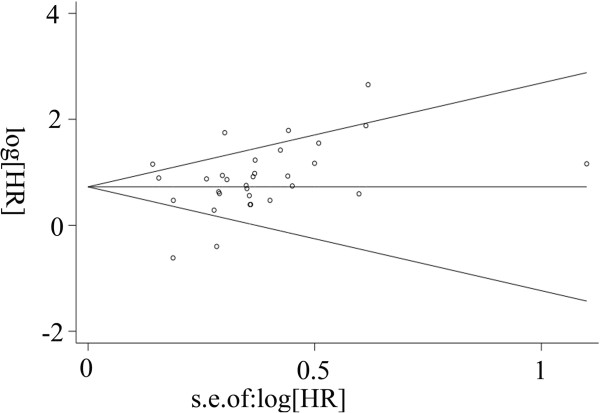
Begg’s funnel plot of publication bias. Funnel plot for the visual assessment of the presence of publication bias associated with all of the studies included in the meta-analysis. The funnel graph plots the log of the hazard ratio (HR) against the standard error of the log of the HR (an indicator of the sample size). The open circles indicate the individual studies. The line in the centre represents the pooled HR. Egger’s test for publication bias was not significant (p = 0.174).