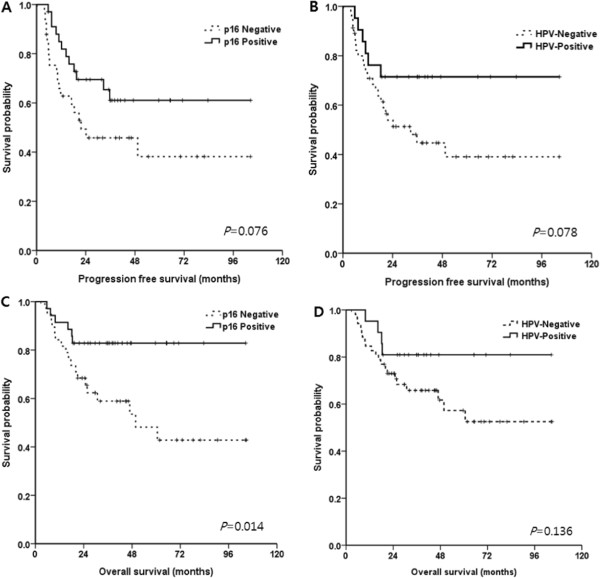
Figure 1.

PFS and OS according to HPV and p16 expression. The 3Y-PFS showed a greater trend in p16+ or HPV+ than p16- or HPV- patients (A, B). In the OS analysis, the 3Y-OS in p16+ patients was significantly higher than in p16- patients (C). However, there was no statistical significance according to HPV status (D).
