
Figure 1.
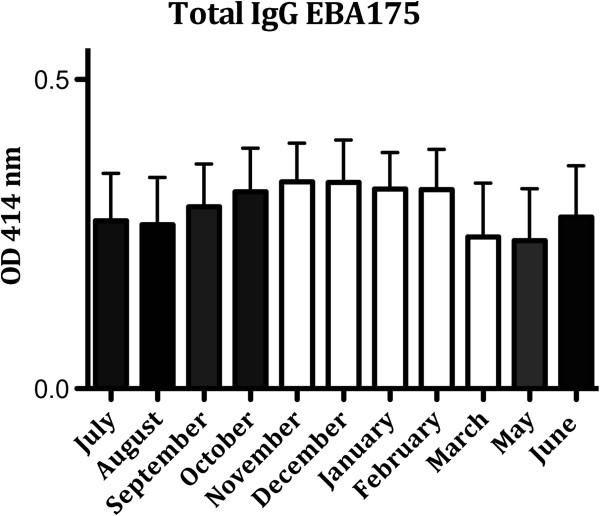
Total IgG responses to EBA175 in individuals five to 70 years old (number of individuals = 40) from July 2009 to June 2010 (number of samples = 302). The bars show mean ± SEM optical density (OD) value at 414 nm. (April not shown, no sample collection). (Black bars = rainy season; white bars = dry season). PfRh2: Data not shown.