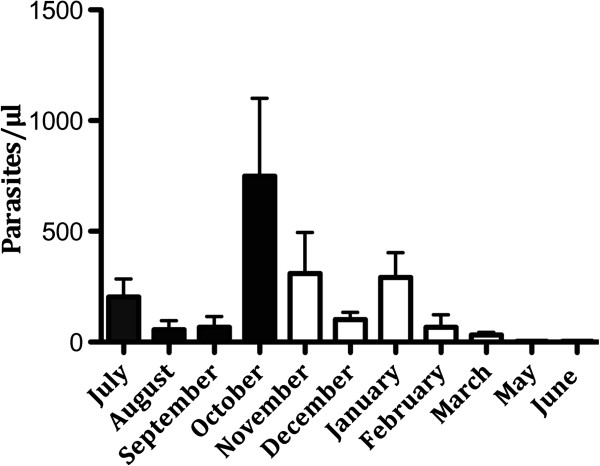
Figure 3.

Parasitaemia in individuals (n = 39) five to 70 years old from July 2009 to June 2010. The bars show mean ± SEM parasitaemia (parasites/μl). (April not shown, no sample collection; June: one individual who had very high parasitaemia, 15 168 parasites/μl, was excluded from this figure. (Black bars = rainy season, white bars = dry season).
