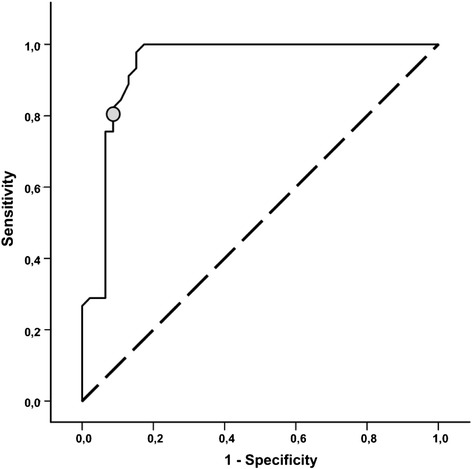
Figure 2.

Receiver operating characteristic (ROC) curve: receiver operating characteristic (ROC) curve illustrating the true positive rate (sensitivity; y-axis) vs. the false positive rate (1-specificity; x-axis) at increasing TAHSI-score values. The area under the ROC curve was 0.94 (95% CI 0.89 to 0.99; p < 0.001). At a cut-off score of 20 (circle), sensitivity to detect members of the tonsillectomy group with chronic or recurrent tonsillitis was 80%, the specificity 90%.
