
Figure 1.
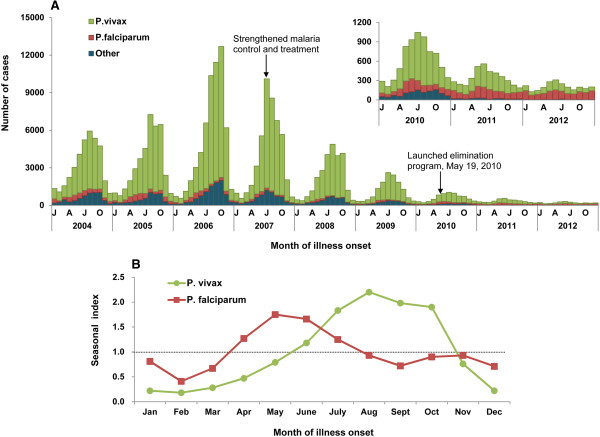
The seasonal distribution of malaria cases by month in China, 2004–2012. (A) The epidemic curve of cases by plasmodium species. Others contained Plasmodium ovale, Plasmodium malariae, mixed infection cases and untyped cases. (B) The seasonal index of P. vivax and P. falciparum malaria. The index was calculated by month, and it was the average case number for a given month (i.e. May) divided by the mean of case number in that corresponding month (i.e. May) during the whole nine years of 2004-2012. No obvious seasonal fluctuation was expected if the seasonal index of each month was close to 1.0.