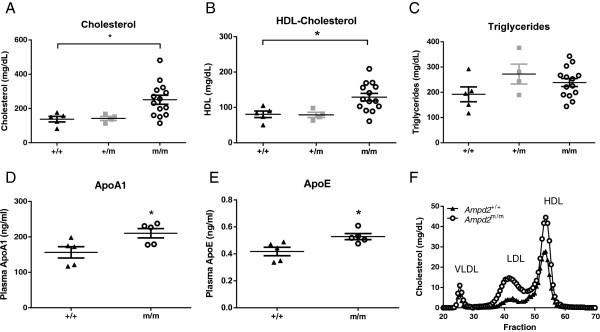
Figure 2.

Lipid parameters of Ampd2 m/m , Ampd2 +/m and Ampd2 +/+ mice. Plasma total cholesterol (A), HDL-C (B), triglyceride (C), ApoA1 (D), ApoE (E) levels and FPLC lipoprotein analysis (F) of 9-week old mice. Individual mouse values are shown with means ± SEM. Statistical analyses were carried out by one-way ANOVA using a Tukey post test for panels A, B and C and by unpaired two-tailed t-tests for panels D and E; * p <0.05 vs. Ampd2 +/+.
