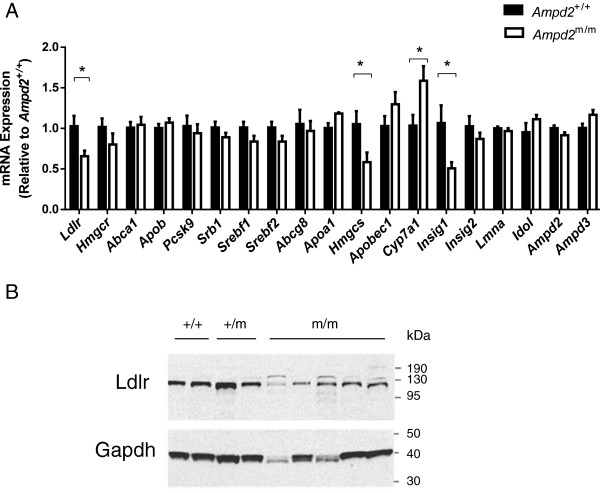
Figure 3.

Gene expression analysis of Ampd2 m/m and Ampd2 +/+ mice. A) Liver mRNA levels were assessed by quantitative RT-PCR for an array of lipid metabolism genes on fed 9-week old Ampd2 +/+ and Ampd2 m/m mice (n = 5). Statistical analyses were carried out by unpaired two-tailed t-tests; * p <0.05 vs. Ampd2 +/+. B) Liver immunoblot analysis of Ldlr protein in Ampd2 +/+, Ampd2 +/m and Ampd2 m/m mice.
