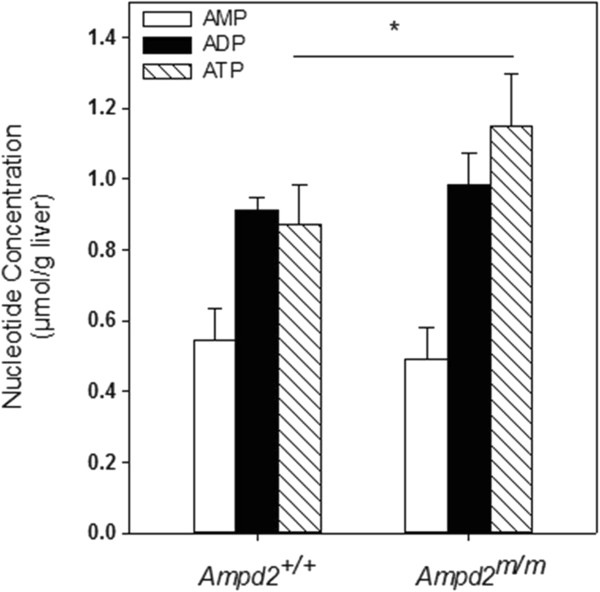
Figure 4.

Hepatic AMP, ADP, and ATP levels in Ampd2 +/+ and Ampd2 m/m mice. Hepatic AMP, ADP, and ATP levels were determined by HPLC. Open bars represent AMP; solid bars - ADP and hatched bars - ATP. Statistical analysis was carried out by unpaired two-tailed t-tests, * p <0.05 vs. Ampd2 +/+.
