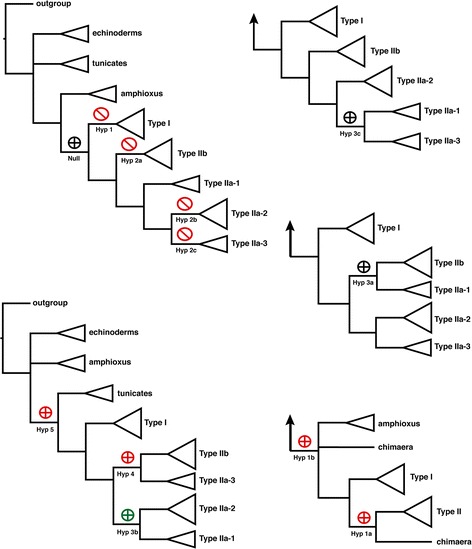
Figure 7.

Results of constrained topology tests using a stepping-stone model for Bayes Factor analyses [ 37 ] . The shape of each symbol indicates the type of topology test used: plus inside a circle indicates a positive constraint, and slash inside a circle indicates a negative constraint. The color of each symbol indicates whether the constrained topology was significantly worse (red), better (green), or not significantly different from (black) the null hypothesis. More than one test is symbolized on each tree and constraints were applied only to the branch indicated; ancestral and derived branches were not constrained. Monophyletic clades from Figure 5 are summarized as triangles, but an individual sequence for the chimaera Type I receptor is listed separately in some cases. Positive constraints (circled plus) forced monophyly for the labeled branch and negative constraints (circled diagonal line) prohibited monophyly for the labeled branch. Arrows at the base of trees are symbols that summarize all ancestral clades.
