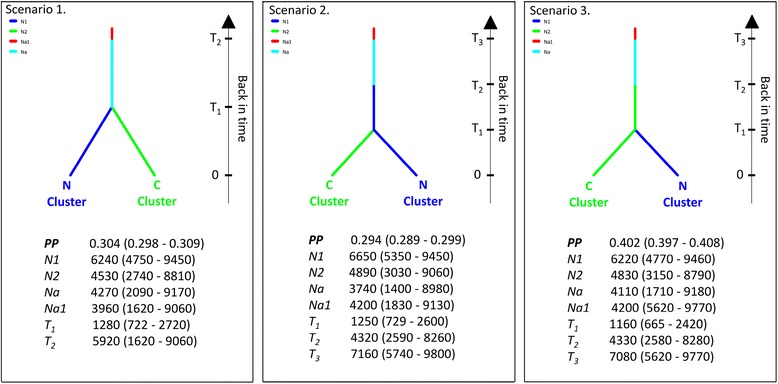
Figure 2.

Representation of three final competing scenarios tested with approximate Bayesian computation (ABC). This analysis was based on a matrix including individuals displaying a probability of belonging to one of the two clusters over 0.9 (STRUCTURE software). Ni corresponds to effective population size of each cluster, and Ti corresponds to the time expressed in numbers of generations since divergence. The following conditions were considered: T1 < T2, T2 < T3, with 0 being the sampling date. Abbreviations are as follows: C; Central cluster, N; Northern cluster, PP; Posterior probability and their associated 95% confidence interval.
