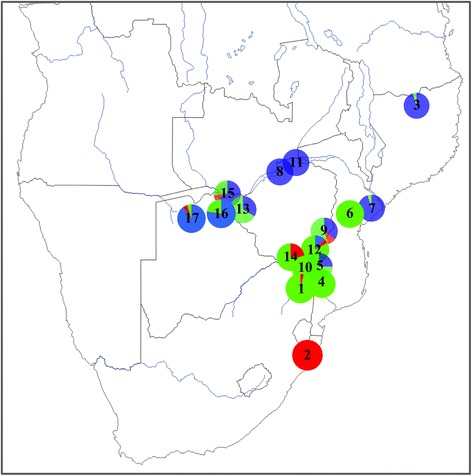
Figure 4.

Geographical representation of the three clusters assessed with STRUCTURE software (for SLs with N ind > 3). Angola and Zambia are not represented due to the low sample sizes from those areas. Blue corresponds to the Northern cluster (N), green to the Central cluster (C) and red to the Southern cluster (S). The sampling localities are also given: 1. Kruger, 2. Hluhluwe-iMfolozi, 3. Niassa, 4. Limpopo, 5. Manguana, 6. Gorongosa, 7. Marromeu, 8. Nyakasanga, 9. Malilangwe, 10. Crooks Corner, 11. Mana Pools, 12. Gonarezhou, 13. Hwange, 14. Sengwe, 15. Victoria Falls, 16. Chobe, 17. Okavango Delta.
