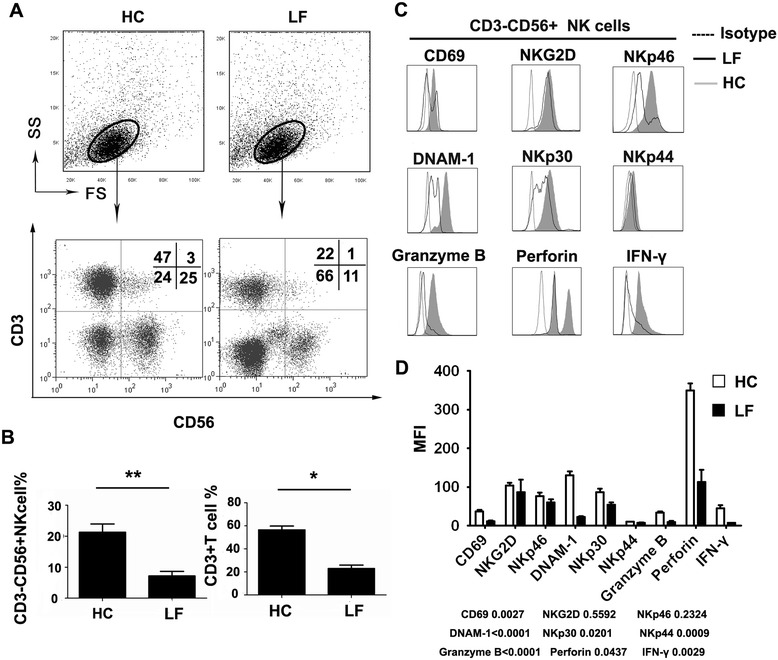
Figure 1.

The variation in peripheral blood NK cells between hepatitis B related LF patients and healthy controls. (A) Representative dot plots of CD3+ and CD56+ staining in PBMCs isolated from healthy control subjects (HC) and hepatitis B related LF patients (LF). The total number of 1 × 10⁵ cells per gate was analyzed. The values in the quadrants represent the percentages of CD3-CD56+ NK cells, CD3+CD56+ NKT cells, CD3+CD56- T cells, and CD3-CD56- cells. (B) The summarized data show the percentages of CD3-CD56+ NK cells and CD3+ T cells in HC and LF. (C) CD3-CD56+ NK cells were gated. Representative primary FACS histograms depict the expression of activation markers, including NKp30, NKp44, NKp46, NKG2D, DNAM-1, CD69, cytolytic granules (perforin and granzyme B) and cytokine (IFN-γ) production by peripheral NK cells from LF (open profiles with solid lines) and HC (gray filled profiles). Open profiles with dotted lines show the isotype control. (D) Pooled data show the MFI of peripheral NK cells expressing activation receptors, as well as perforin, granzyme B and IFN-γ production from HC (open profiles) and LF (black profiles). The values given in B and D represent the means ± SEM of five separate experiments. *P <0.05 and **P <0.01 indicate significant differences between HC and LF (B and D).
