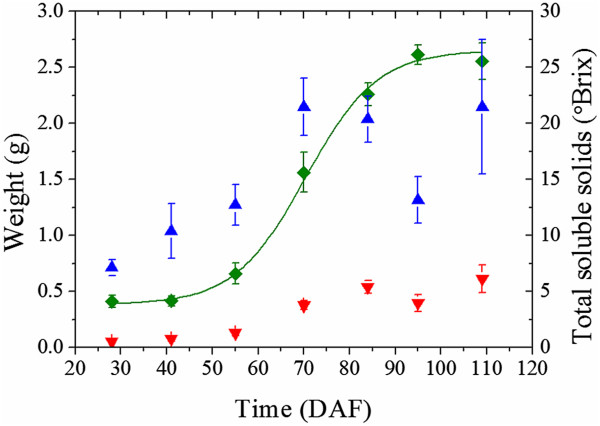
Figure 3.

The physical characteristics of the grape berries. The concentrations of soluble solids of the grape berries (Green ♦), as well as the fresh weight (Blue ▲) and dry weights (Red ▼) of the berries, are presented with respect to the number of days after flowering. A sigmoidal function (solid green curve) of the form a 1 + (a 2 - a 1)/(1 + exp(-(DAF - x 0)/w)) was fitted to the soluble solids values by nonlinear regression (adjusted R2 = 0.99), where a 1 = 26.1 (the approximate maximum soluble solids value), a 2 = 3.9 (the approximate minimum soluble solids value), x 0 = 69.7 (the inflection point) and w =7.4 (the change in DAF which yielded the greatest change in the soluble solids value). The error bars are given by the standard deviation of soluble solids values at each time point.
