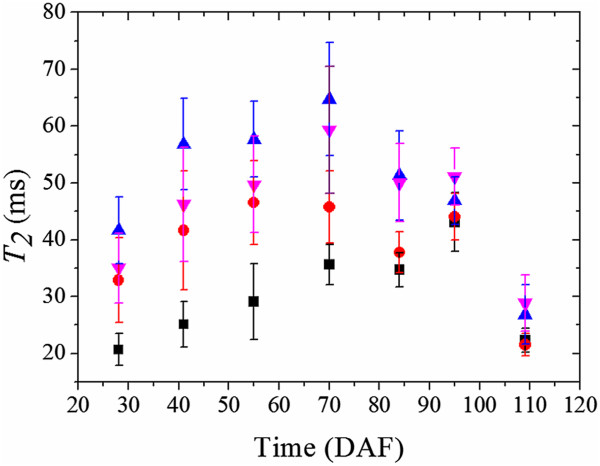
Figure 6.

Transverse (T 2 ) relaxation of the major tissue groups of the grape berry with respect to time (transverse plane). The transverse relaxation values for the exocarp (■), outer mesocarp (Red ●), inner mesocarp (Blue ▲) and septum (Pink ▼). The error bars are given by the standard deviation of the transverse relaxation values at each time point.
