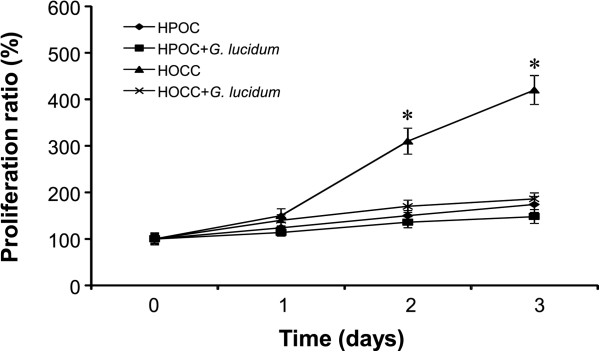
Figure 1.

Growth curve of HOCC and HPOC in DMEM with 5% BCS or with addition of 10 ug/ml G. lucidum . Proliferation ratio (%) indicates the cell proliferation rate at other times compared with that at 0 h when cell numbers are considered as 100%. n = 5, Data are shown as mean ± S.D. *P < 0.05 vs HOCC + G. lucidum.
