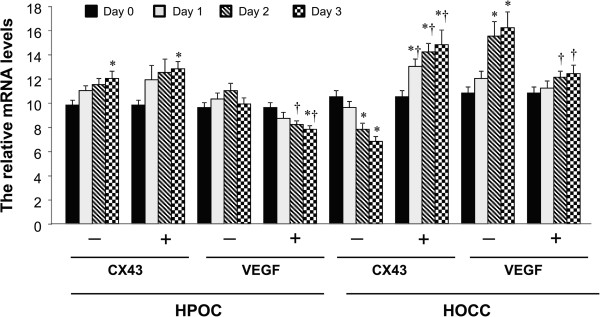
Figure 2.

The relative levels of Cx43 and VEGF mRNA in HOCC and HPOC. "-" stands for untreated group (control). "+" stands for G. lucidum-treated group at dose of 10 ug/ml. Data are shown as mean ± S.D. of three independent experiments. All the cells were treated with G. lucidum for successive 3 days. *P < 0.05 vs respective day 0; †P < 0.05 vs corresponding untreated group.
