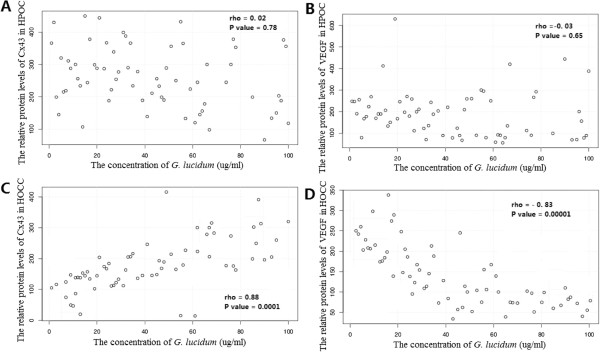
Figure 6.

The relationship between the different concentrations of G. lucidum and Cx43 (A and C) or VEGF (B and D) protein levels in HOCC and HPOC. Statistical analysis was done by Spearman’s rank correlation test.

The relationship between the different concentrations of G. lucidum and Cx43 (A and C) or VEGF (B and D) protein levels in HOCC and HPOC. Statistical analysis was done by Spearman’s rank correlation test.