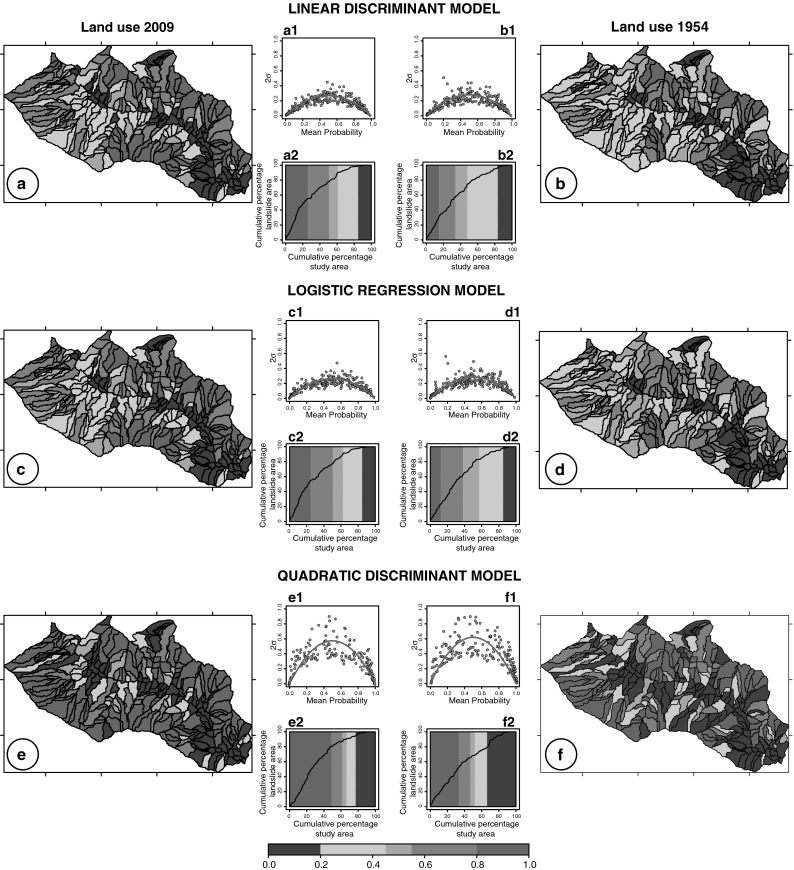
Fig. 3.

Results of single landslide susceptibility models (2 % threshold). On the right models prepared using the 2009 land use (a, c, e) and on the left the 1954 land use map (b, d, f) with the predicted LS in five unequally spaced classes; (a1, b1, c1, d1, e1, f1) plot showing estimates for the model uncertainty in each slope unit and (a2, b2, c2, d2, e2, f2) success rate curve
