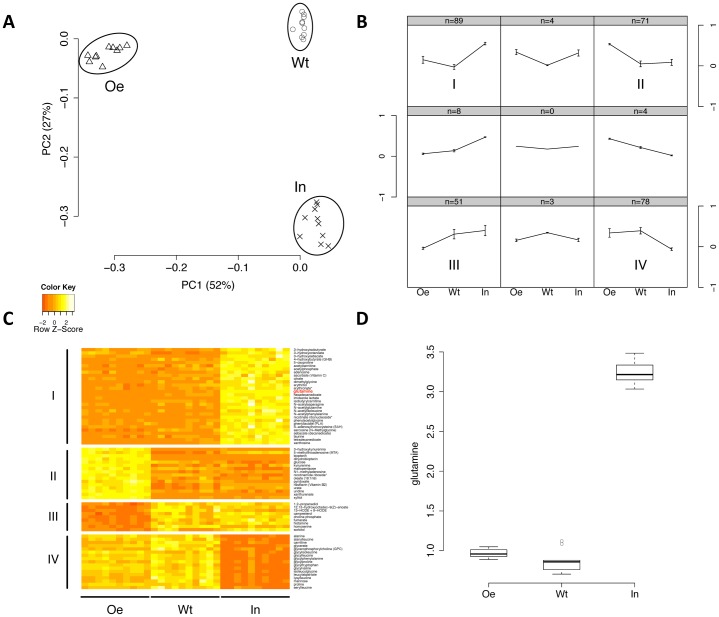
Fig. 5. Global metabolomic profiling indicates negligible changes in CTPsyn activity in vivo.
(A) Principle component analysis shows that the samples of wild-type (Wt), CTPsyn inhibition (In), and CTPsyn overexpression (Oe) groups are clearly segregated. Two principal components (PC1 and PC2) are plotted and their proportions of variance are labeled. (B) The mean values of compounds in each state were normalized to (−1,1) and clustered into nine patterns by self-organizing mapping. The numbers of compounds in each pattern are showed on the top of the grids. The patterns that contain the most compounds are indicated by (I, II, III, V). (C) The heat map shows metabolites in major patterns that have significantly differential levels in three groups. Seventy-two metabolites in major patterns of (B) SOM (I, II, III, IV) were selected by one-way ANOVA with Bonferroni adjusted P<10−5. (D) The levels of glutamine in three groups are shown in the boxplot. Glutamine belongs to pattern I and is also colored in red in panel C.

