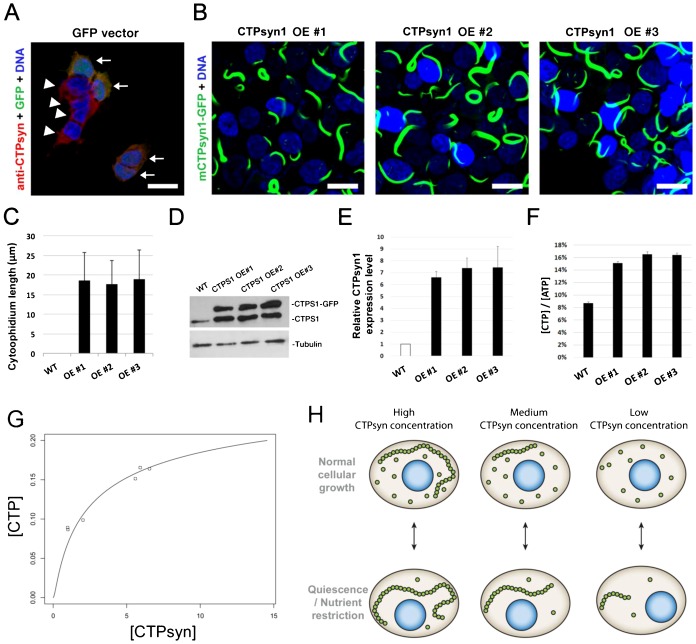
Fig. 6. CTPsyn, cytoophidia and CTP production.
(A) Cytoophidia are undetectable in wild-type and GFP vector transfected human 293T cells. (B) The mCTPsyn1-GFP proteins were stably expressed by CTPsyn1 OE#1, CTPsyn1 OE#2 and CTPsyn1 OE#3 cell lines. Almost every cell contains one or more cytoophidia. (C) Quantification of length of cytoophidia expressed by three independent cell lines. (D) Western blot of CTPsyn1 protein in wild-type, and mCTPsyn1-GFP expressing 293T cell lines. (E) Quantification of the relative protein abundance of endogenous CTPsyn1 and exogenous mCTPsyn1-GFP in CTPsyn1 OE#1, CTPsyn1 OE#2 and CTPsyn1 OE#3 cell lines. (F) The relative CTP concentration in cell lysates of wild-type, and three CTPsyn1 overexpression 293T cell lines. Overexpression of CTPsyn moderately increased intracellular CTP concentration in human cells. (G) The fitting of total CTPsyn and CTP concentration using the non-linear relationship derived from our mathematical model (see text). The x axis is total CTPsyn and y axis is CTP concentration. Data points represent experimentally measured values in wild type and CTPsyn overexpressing human 293T cells. (H) Proposed model of cytoophidia assembly in response to nutrient or developmental conditions. Scale bars: 20 µm.

