
Fig. 2. Effect of elevated CO2 on resting frequency of squid.
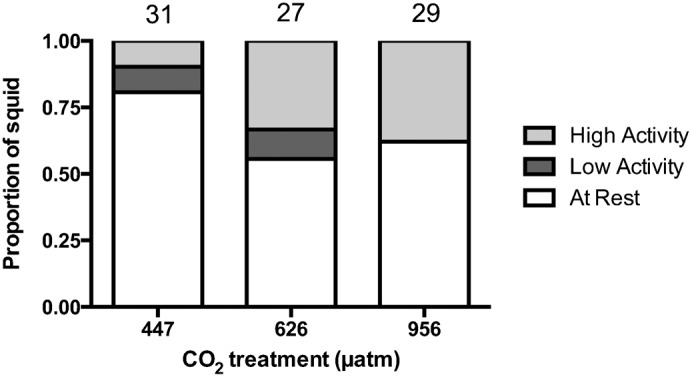
Proportion of squid that were at rest (zero line crosses), displayed low activity levels (1–25 line crosses), and high activity levels (more than 25 line crosses) in behavioural trials for individuals exposed to control (447 µatm), moderate (626 µatm), or high (956 µatm) CO2. Sample sizes are displayed above the bars.