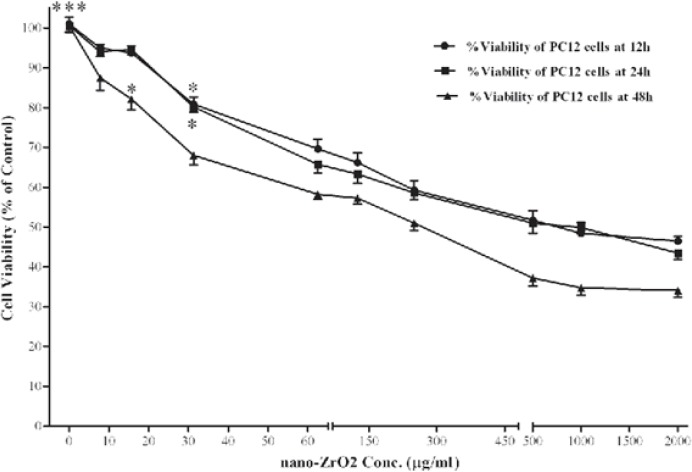
Figure 3.
Effects of nano-ZrO2 on PC12 cell viability. Cells were treated with increasing concentrations of zirconia for 12, 24 and 48 h. The cell viability (quantified by MTS assay) is shown and discussed as percentage of control group (zirconia 0 µg/mL). Mean and SEM of three independent experiments are shown. One way ANOVA analysis shows significant difference between the data which were investigated in each time. ***p<0.001 versus all concentration more than 31.25 µg/mL in all 3 exposure time and *P<0.05 versus control group.

