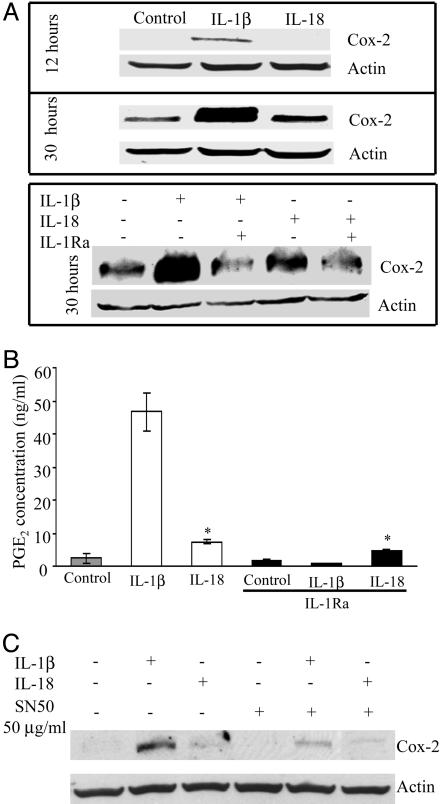
Fig. 6.
COX-2 and PGE2 production in IL-1β- or IL-18-stimulated cells. (A) A549-Rβ cells were stimulated with IL-1β (10 ng/ml) or IL-18 (50 ng/ml), and Western blot analysis was performed after 12 (A) or 30 (B) h. (B) PGE2 levels in supernatants of cells stimulated with the same concentrations of cytokines for 48 h in the absence or presence of IL-1Ra (10 μg/ml). The data represent the mean ± SEM, n = 3. *, P < 0.05 compared to control. (C) Immunoblot of COX-2 at 24 h in A549-Rβ cells pretreated for 1 h with SN-50 and then stimulated with IL-1β or IL-18.

