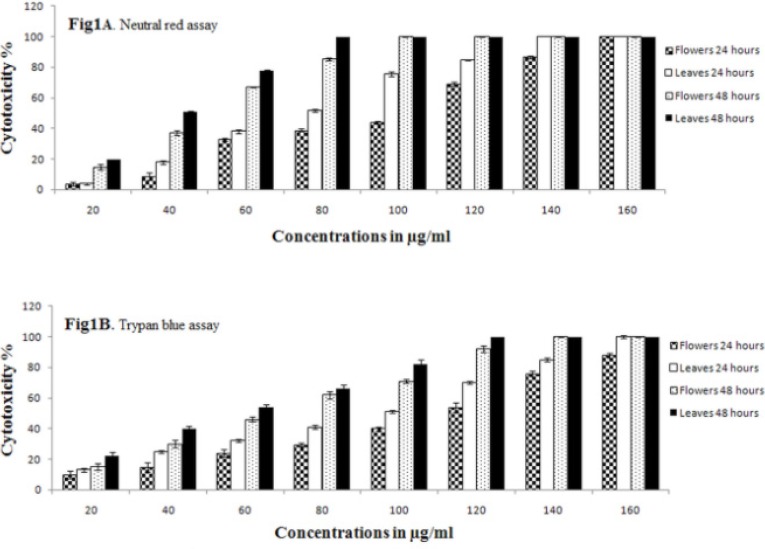
Figure 1.
Cytotoxic effect of various concentrations (20, 40, 60, 80, 100, 120, 140 and 160) μg/mL of F. angulata Boiss. flower and leaf extracts on AGS cells at 24 h and 48 h. A) The percentage of cytotoxicity values were measured with neutral red and B) The percentage of cytotoxicity values were measured with trypan blue assays. Bars are represented by the mean ± S.E.M. of three independent experiments (n = 3). (p <0.05 vs. control group).

