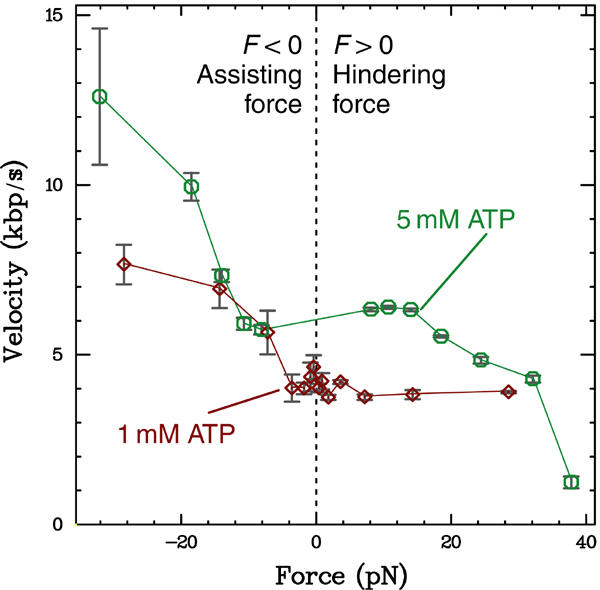
Figure 3.

Force–velocity relations for FtsK50C measured at 1 and 5 mM ATP. At both ATP concentrations, there is a plateau of constant velocity for small forces. The velocity measured at 5 mM ATP begins to decrease above a hindering force of 15 pN, while no decrease is seen in the 1 mM data up to 29 pN. The hindering-force data indicate that the FtsK50C reaction pathway has force-independent biochemical step(s) in series with force-dependent mechanical step(s) (see Discussion). Plotted bars indicate standard error; large error estimates indicate regimes where the event frequency and size are small (see Figure 4).
