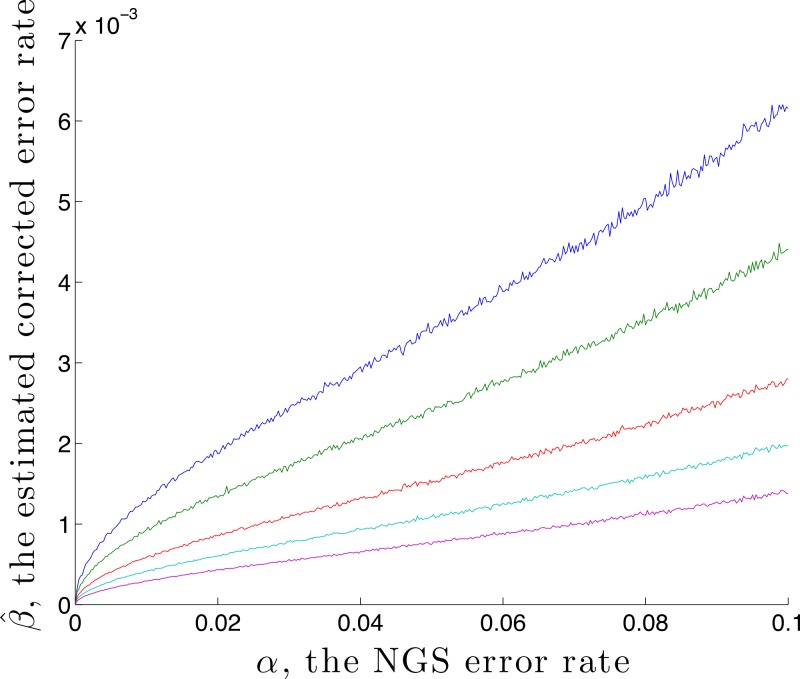
Figure 2. The estimated residual error rate after correction plotted against the initial error rate α, when the true initial distribution is the degenerate p = (1, 0, 0, 0).
The larger the coverage n, the more accurately estimates q and so the more dependable the correction, hence the smaller is β. Curves are shown for coverage n of 1,000 (blue), 2,000 (green), 5,000 (red), 10,000 (cyan) and 20,000 (magenta). Each point on the graph is the mean of N = 5,000 replicate trials.

