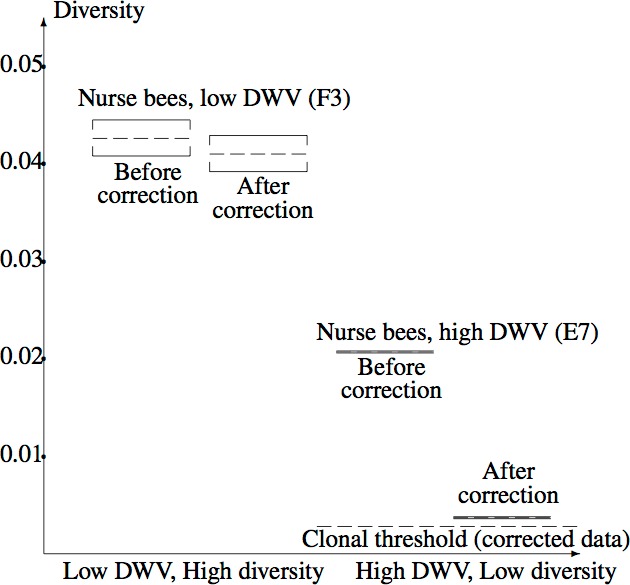
Figure 5. Confidence intervals for true mean diversity across the capsid region, for the high diversity (F3) and low diversity (E7) samples, both before and after correction for the NGS error.

Correction has a larger effect when the (uncorrected) diversity is low, clearly revealing the reduction in diversity from F3 (low DWV level) to E7 (high DWV level). The clonal threshold for the mean shows that the corrected E7 data plausibly has non-zero diversity.
