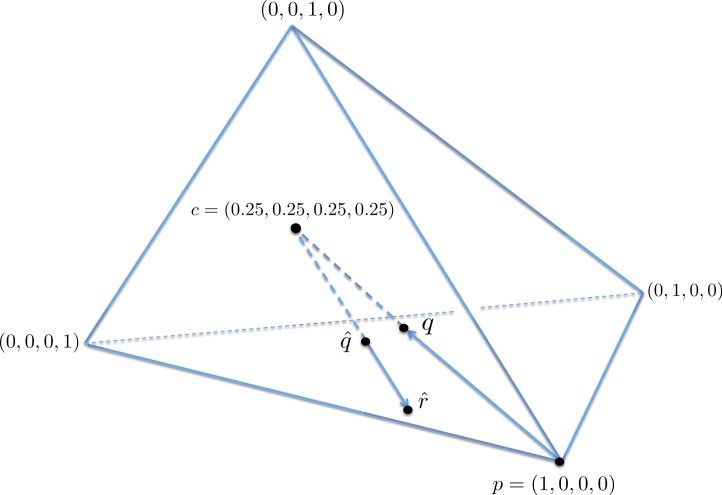
Figure 6. A geometric view of the correction process, showing the tetrahedron of all nucleotide distributions.
When the true nucleotide distribution p is (1, 0, 0, 0), the limiting distribution after next generation sequencing q is along the line from p to the centroid c. Under sampling, we see nearby which is corrected to , lying on the extension of the line from c to .

