Figure 1.

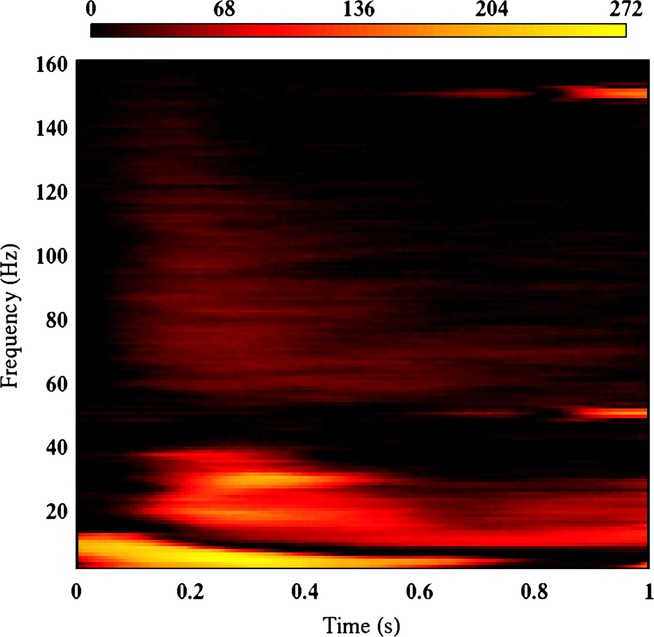
Plot of the number of sensors for which the response to stimuli (averaged across all trials of both conditions) significantly differed from zero for each time × frequency point. The colour scale depicts number of significant sensors.

Plot of the number of sensors for which the response to stimuli (averaged across all trials of both conditions) significantly differed from zero for each time × frequency point. The colour scale depicts number of significant sensors.