Figure 3.

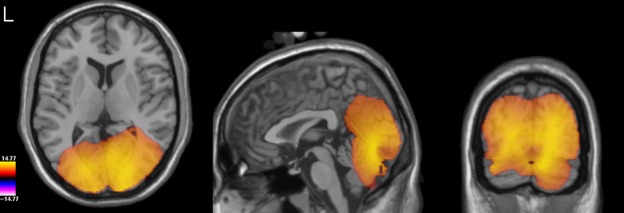
Group-level t-statistical image (thresholded at P < 0.001 FWE) of the difference in response to faces vs. baseline (−500 to −200 ms) in the gamma TFWOI (55–120 Hz, 100–400 ms), overlaid on the template brain.

Group-level t-statistical image (thresholded at P < 0.001 FWE) of the difference in response to faces vs. baseline (−500 to −200 ms) in the gamma TFWOI (55–120 Hz, 100–400 ms), overlaid on the template brain.