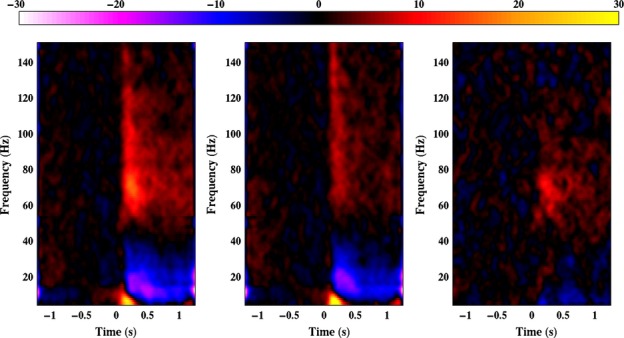
Figure 4.

Group average spectrograms depicting the virtual sensor responses to face (left panel) and scrambled stimuli (middle panel), and the difference between the two responses (right panel). The colour scale depicts amplitude in percentage relative to baseline (−1 to 0 s).
