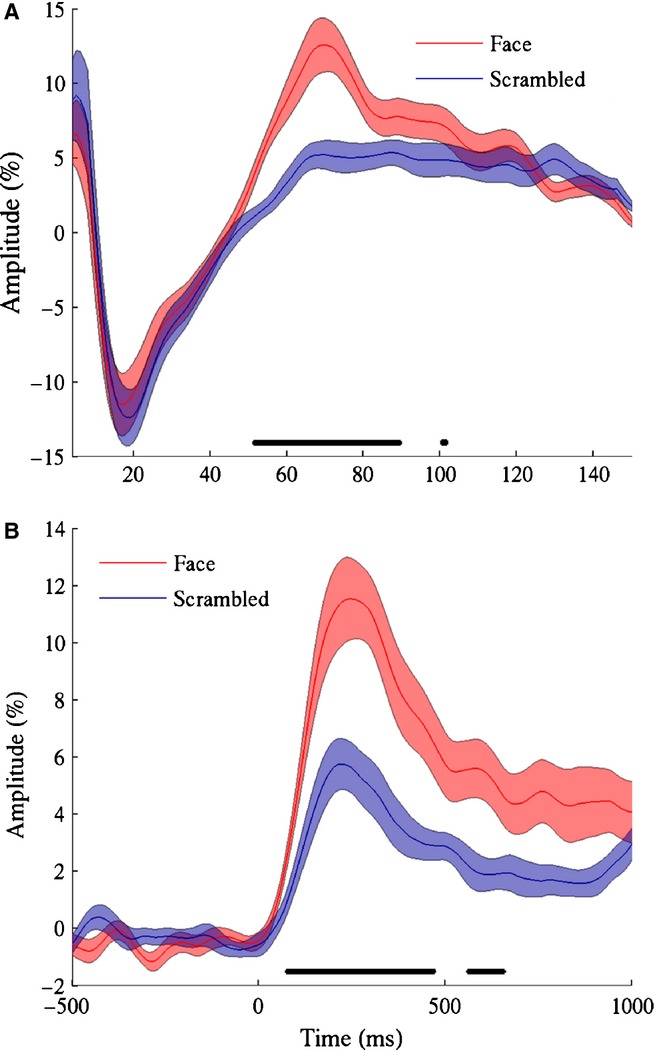
Figure 5.

(A) Group mean (± SE) amplitude spectra of the response from 100 to 400 ms following stimulus onset for both faces and scrambled stimuli. Spectra were smoothed with a uniform kernel of width 9 Hz to reduce spectral noise. (B) Group mean (± SE) amplitude of the gamma (55–120 Hz) response against time for both faces and scrambled stimuli. In both plots the dark bars above the x-axis depict frequencies/times at which the responses to face and scrambled stimuli were significantly different (Wilcoxon signed-rank test, P < 0.01 FDR).
