Figure 3.

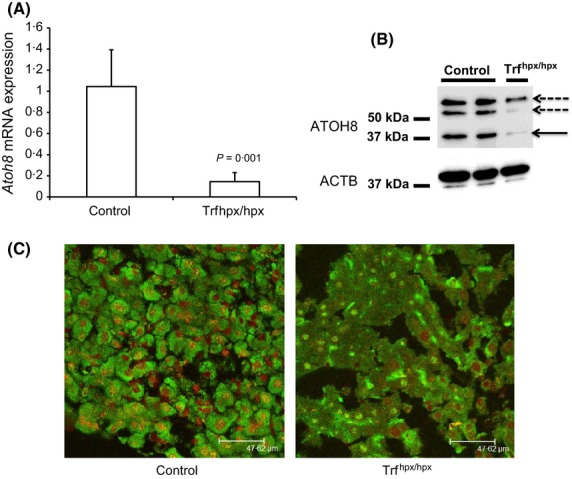
Expression of Atoh8 in HPX mouse liver. (A) Q-PCR shows relative Atoh8mRNA levels as (normalized to Rpl19, plotted as fold change relative to control) in 10- to 11-week-old male Trfhpx/hpx mice compared to control (Trfhpx/+) mice (P = 0·001 Student's ‘t’ test, n = 3 for each group). (B) Western blots for ATOH8 protein in liver extracts from two control (Trfhpx/+) and one Trfhpx/hpx mouse. Solid arrow indicates predicted molecular weight of ATOH8 (∽37 kDa), dashed arrows indicate possible homo- or heterodimers. (C) ATOH8 immunostaining (visualized in green) in liver sections from male 7-week-old Trfhpx/hpx compared to an age- and sex-matched control (Trfhpx/+); counterstain is propidium iodide (red).
