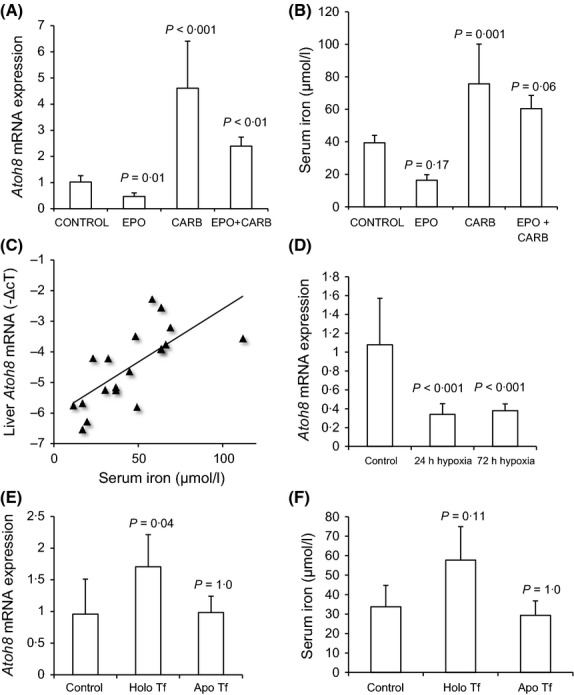
Figure 5.

Effect of Hypoxia, EPO, Carboplatin and Transferrin on liver Atoh8 mRNA levels. (A) qPCR shows relative Atoh8 levels (normalized to Rpl19; plotted fold-change relative to control). Control (saline-injected; n = 7), EPO (n = 4), carboplatin (CARB; n = 4) and EPO and Carboplatin injected mice (EPO + CARB; n = 4). (B) serum iron levels in treated mice. (C) Correlation between serum iron and Atoh8mRNA in all mice (Pearson correlation coefficient, R2 = 0·70, P = 0·013, n = 19). (D) qPCR of liver Atoh8mRNA levels in control (normoxia) and in mice exposed to hypoxia for 24 and 72 h (Atoh8 levels normalized to Rpl19, plotted as fold-change relative to control) (E) Atoh8 levels in control (saline injected) (n = 7), Holo-transferrin (n = 4) or Apo-transferrin (n = 4) (Atoh8 levels normalized to Rpl19; plotted as fold-change relative to control) (F) serum iron levels in treated mice. Data are presented as mean ± SD. Statistical comparisons were made using 1-way anova with Tukey's post hoc test.
