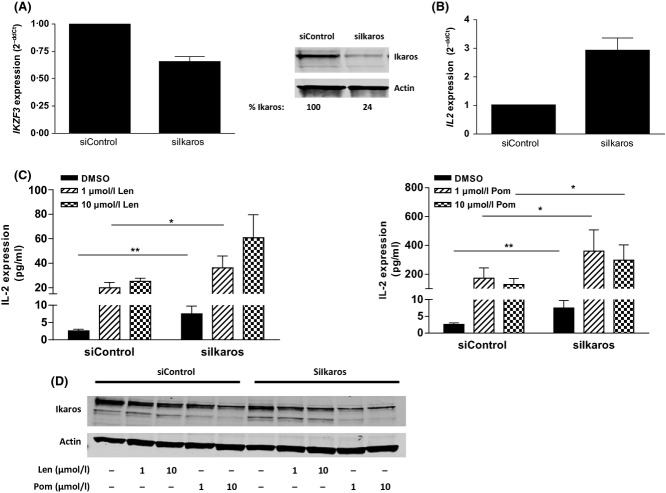
Figure 7.
Ikaros is a negative regulator of IL2 in T cells and silencing Ikaros mimics lenalidomide or pomalidomide treatment. (A) Primary T cells were transfected with Control siRNA or Ikaros siRNA for 48 h then assayed for IKZF1 gene expression or lysates were separated by SDS-PAGE and immuno blotted for Ikaros expression. Values represent Ikaros densitometry values normalized to Actin. (B) T cells transfected with control or Ikaros siRNA for 24 h were assayed for IL2 gene expression (n = 4). (C) 24 h post-siRNA transfection, T cells were drug treated for 48 h (left, lenalidomide; right, pomalidomide), harvested and IL2 expression was measured by ELISA. Data shown are mean of three donors tested in triplicate. (D) Ikaros and Actin expression was measured by immunoblot after drug treatment. *P < 0·05. and **P < 0·01 using paired t-test. Len, lenalidomide; Pom, pomalidomide; siIkaros, Ikaros siRNA; DMSO, dimethyl sulfoxide; SDS-PAGE, sodium dodecyl sulphate polyacrylamide gel electrophoresis; ELISA, enzyme-linked immunosorbent assay.

