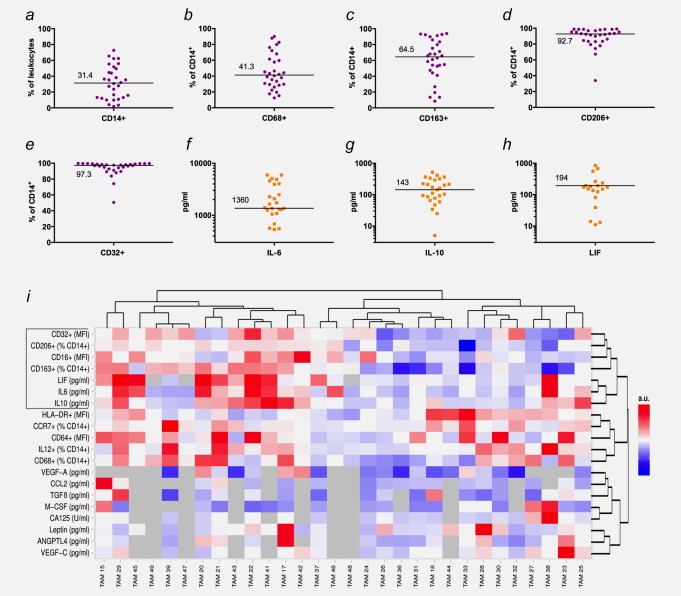
Figure 1.
Expression patterns of surface markers on TAMs and cytokine ascites levels in ovarian cancer patients. (a–e) Expression of surface markers associated with macrophage polarization and tumor progression (n = 30; FACS analyses). (f–h) Distribution of IL-6, IL-10 and LIF levels (n = 30; ELISA). (i) Heat map generated by hierarchal clustering of expression data. Data were median centered and scaled from −1 to +1 for each marker or cytokine, with bright red indicating the highest expression levels and bright blue the lowest expression level. Missing values are indicated in gray. Samples with more than 25% of markers/cytokines missing were not considered for clustering of markers or cytokines and replaced by 0 when clustering samples.

