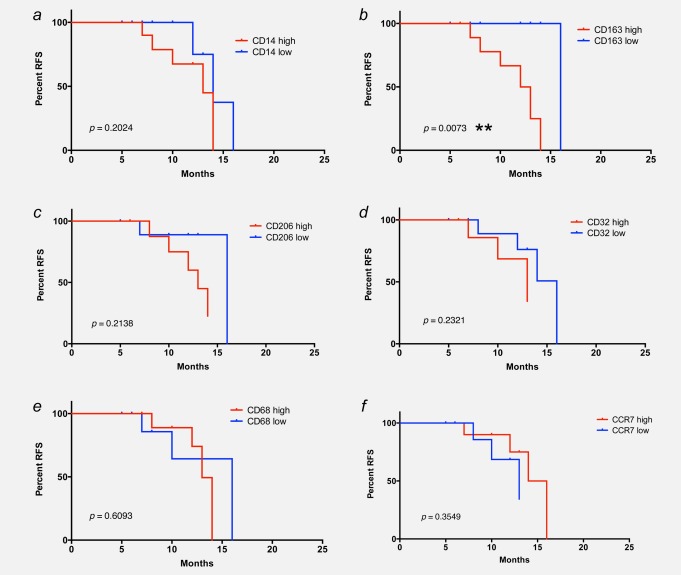
Figure 2.
Association of RFS with CD163 surface expression on ovarian carcinoma TAMs. Kaplan–Meier plots showing the RFS of patients with high or low levels (median centered) of CD14 (% of leukocytes; panel a), CD163 (% of CD14+; panel b), CD206 (% of CD14+; panel c), CD32 (MFI; panel d), CD68 (% of CD14+; panel e) and CCR7 (% of CD14+; panel f) expression on their TAMs. p-Values were determined by Mantel–Cox log-rank test.

