Fig. 3.

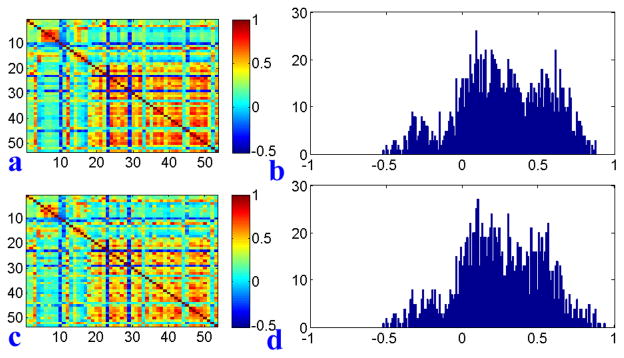
(a) Correlation matrix of real QT data. (b) Histogram of correlation coefficients of real QT data. (c) Correlation matrix of simulated QT data (SET1 with α=0.40). (d) Histogram of correlation coefficients of the simulated QT data.

(a) Correlation matrix of real QT data. (b) Histogram of correlation coefficients of real QT data. (c) Correlation matrix of simulated QT data (SET1 with α=0.40). (d) Histogram of correlation coefficients of the simulated QT data.