Figure 3.

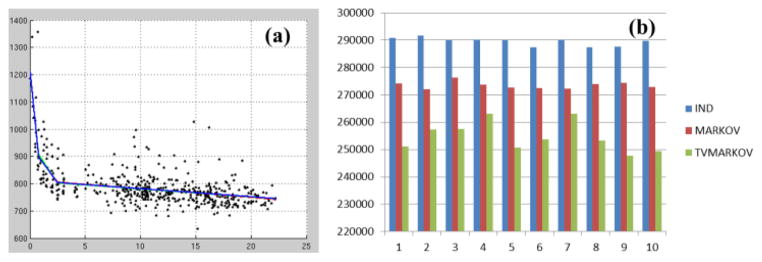
The averaged population growth trajectories from independent (red), Markov (green) and tvMarkov (blue) covariance structures (a). The AIC values from 10 optimizations for the three covariance structures (b).

The averaged population growth trajectories from independent (red), Markov (green) and tvMarkov (blue) covariance structures (a). The AIC values from 10 optimizations for the three covariance structures (b).