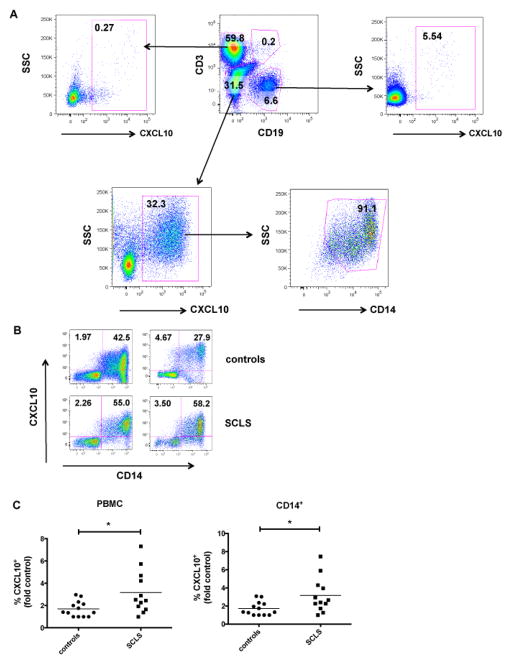
Figure 4.
Abnormal IFNγ-induced CXCL10 production by PBMCs in SCLS. PBMCs were incubated with IFNγ and analyzed for CXCL10 production by flow cytometry. (A) Percentages of CXCL10+ cells among T lymphocytes (CD3+), B lymphocytes (CD19+), and monocyte (CD14+) populations from a representative healthy subject. (B–C) Representative flow plots (B) and analysis of CXCL10+ PBMCs and monocytes from SCLS subjects (n = 12) and healthy subjects (n = 14), presented as the fold control of the lowest value from a healthy donor for each individual experiment, set as ‘1’. *P = 0.02, unpaired t test.

