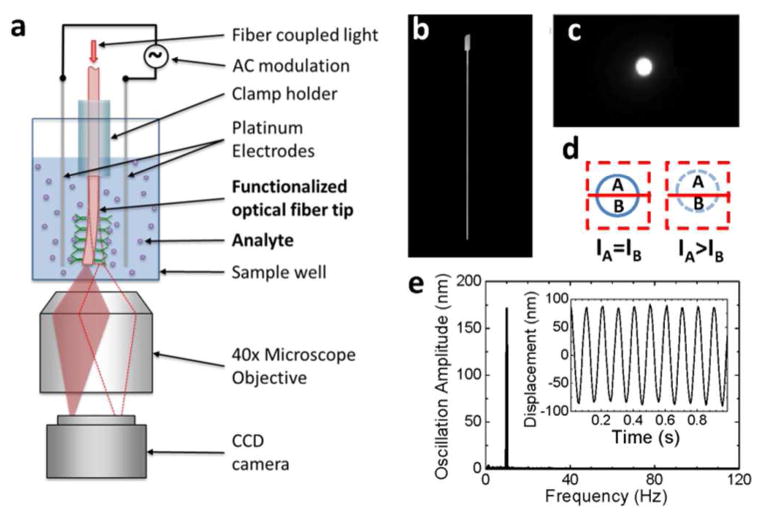
Fig. 1.
Overview of the detection technique. (a) Schematic illustration of the setup. (b) A typical optical fiber with etched tip viewed from side. (c) Image of the fiber tip viewed from the bottom of the microplate well. (d) Differential optical detection for accurate determination of the fiber oscillation amplitude. (e) Fast Fourier transform (FFT) of the fiber oscillation. Inset: Oscillation displacement signal in time domain before FFT. The amplitude and frequency of the applied voltage were 2 V and 10 Hz, respectively. The length and diameter of the fiber were 8.5 mm, and 11 μm, respectively. The buffer was 40 times diluted 1X PBS.

