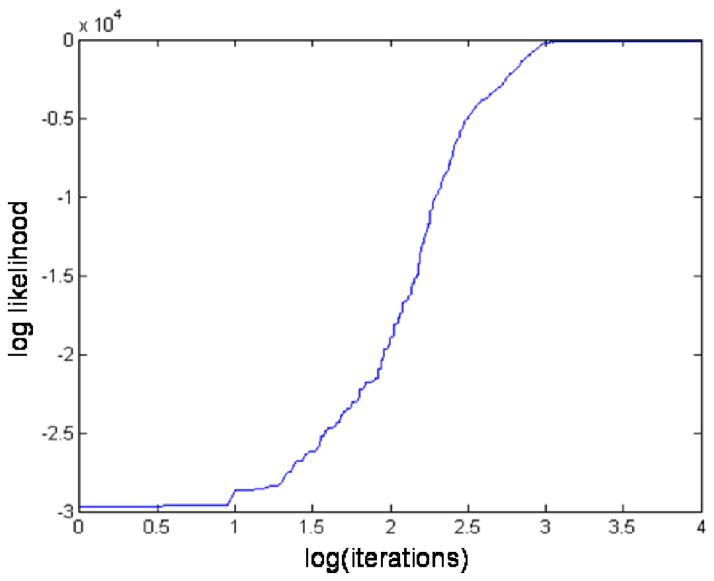
Figure 2.
An example plot of the logarithm (log) of the likelihood showing the burn-in period. Values on the x-axis are the log of the simulation iteration. The likelihood levels off at about 3000 iterations. We use an ample burn–in period of 50000 iterations after which we start recording Markov Chain states.

