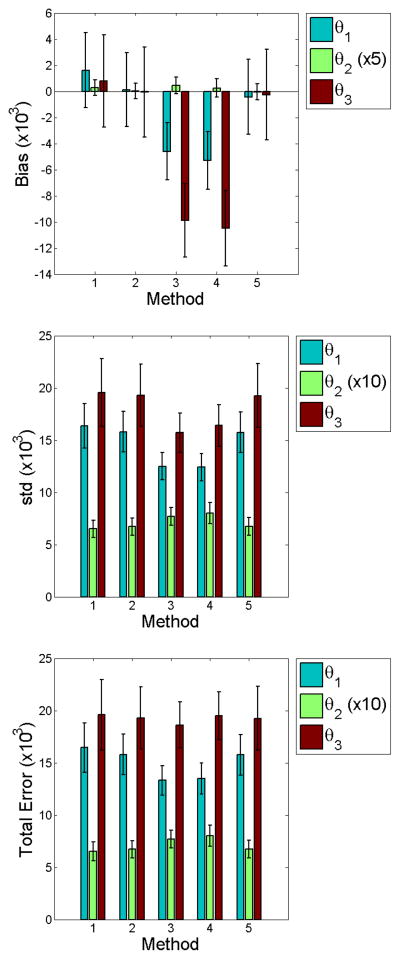
Figure 4.
Bar graphs of the point estimate statistics for low input function noise (CA = 0.5). We find no statistical difference in standard deviation and total error between methods. M3 and M4 show larger bias for θ2 and θ3. Smaller errors in both bias and standard deviation contribute to total errors of no significance.

